|
|
|
|
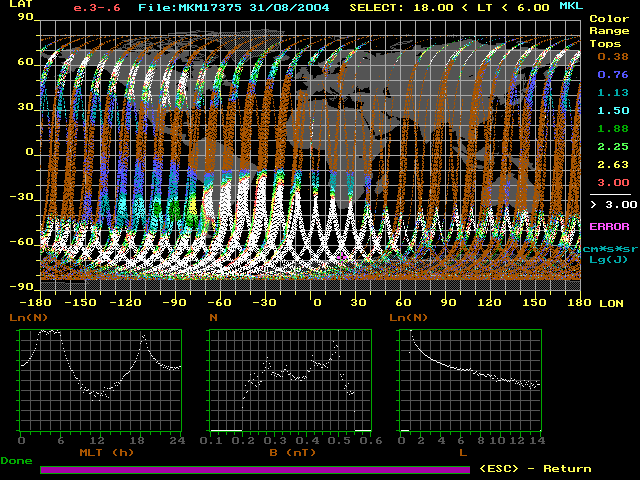
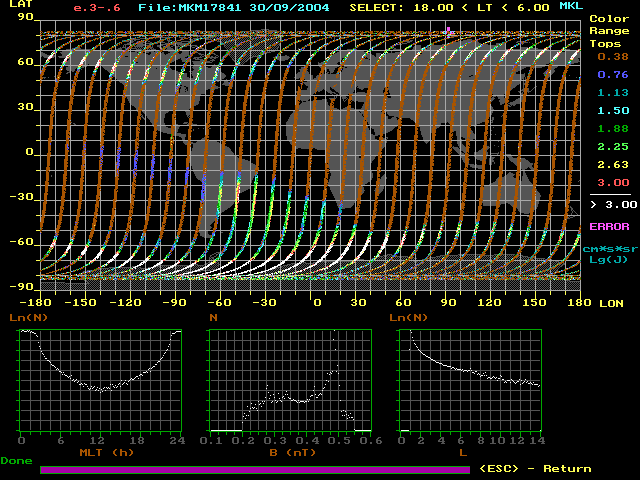
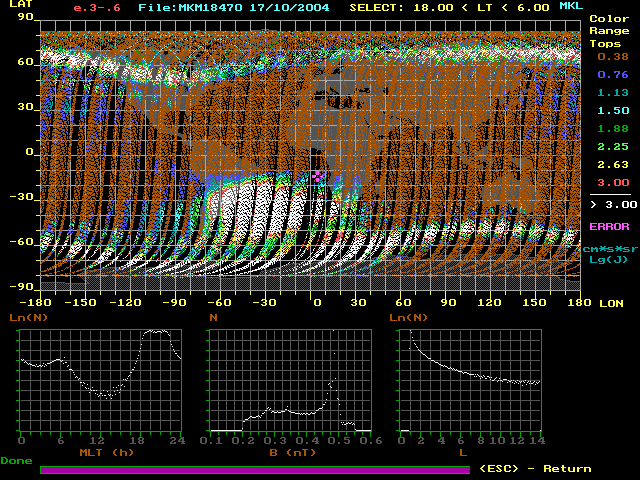
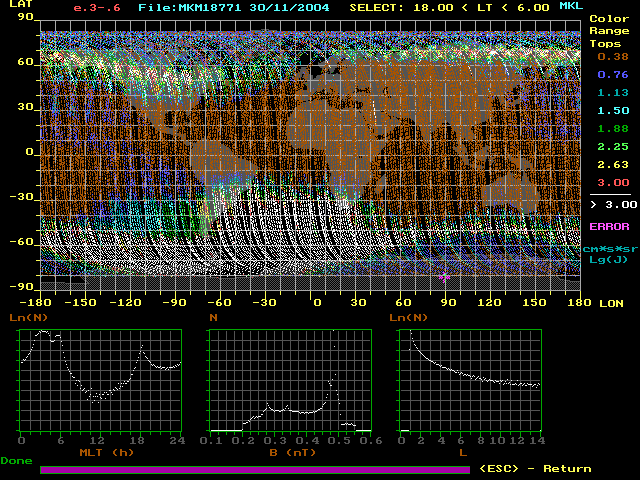
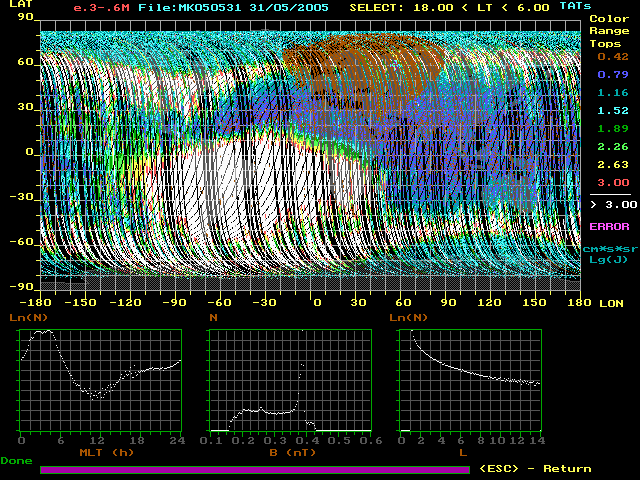
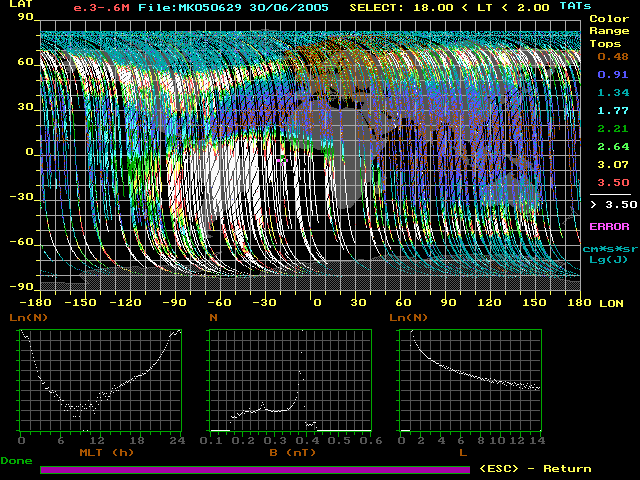
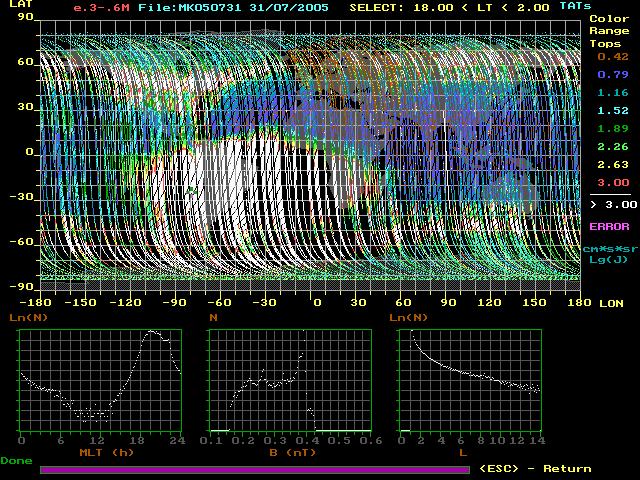
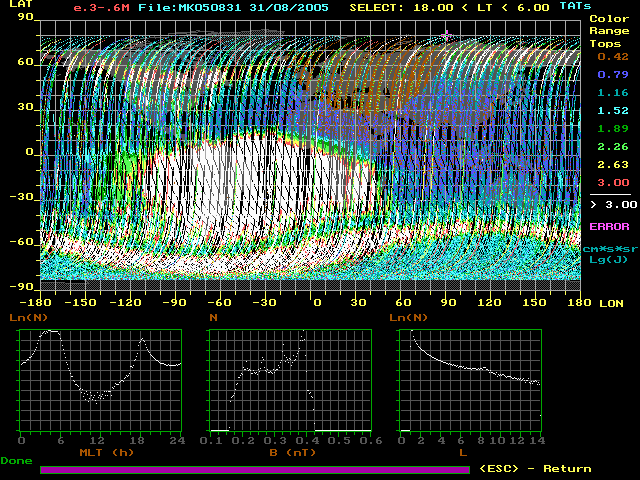
Spatial distributions of electrons with the energy 300-600 keV
[ Overview]
[ 2004]
[ 2005]
[ 2006]
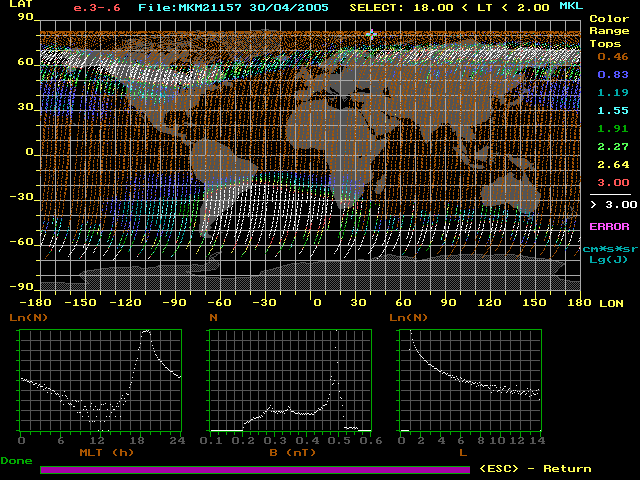
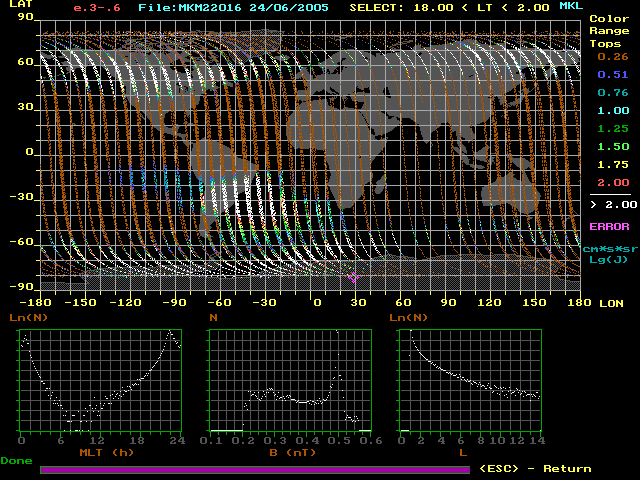
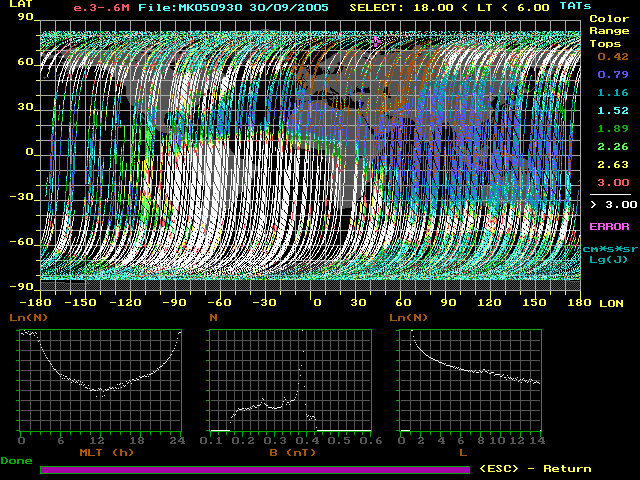
Spatial distributions of electrons with the energy 300-600 keV measured onboard CORONAS-F (2004-2005 years) and “Universitetsky-Tatyana” (2005-2006 years) satellites. Spatial distributions (geographical map) of trapped, quasi-trapped and precipitated electrons with the energy 300-600 keV measured on board CORONAS-F satellite in evening-night MLT sectors. | 2004 | September, 1-30 | October, 1-31 | November, 1-30 | December, 1-31 | | | 2005 | February, 1-28 | March, 1-31 | April, 1-15 | April, 16-30 | June, 1-24 |
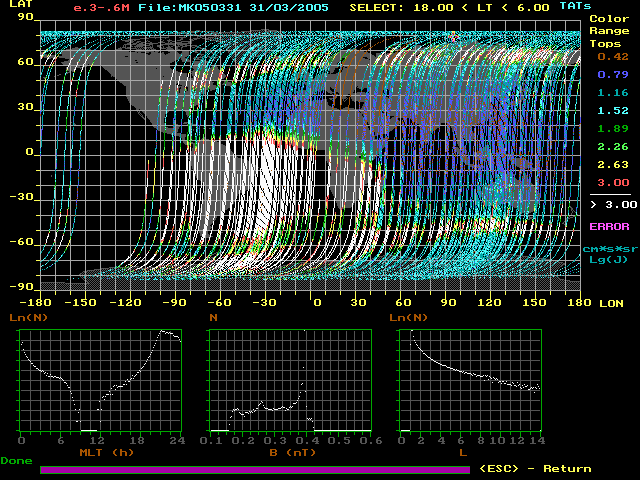
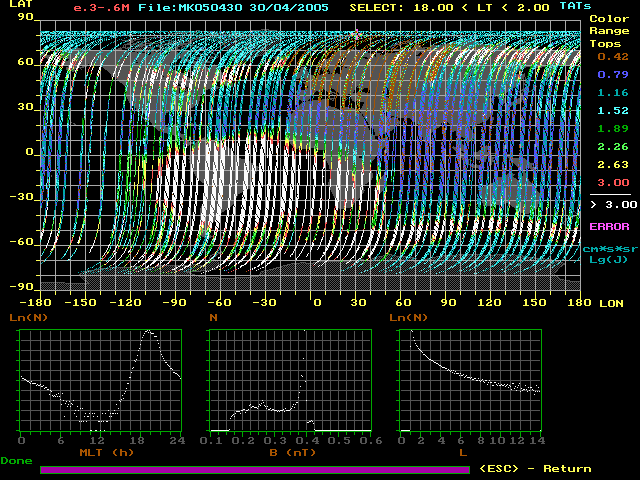
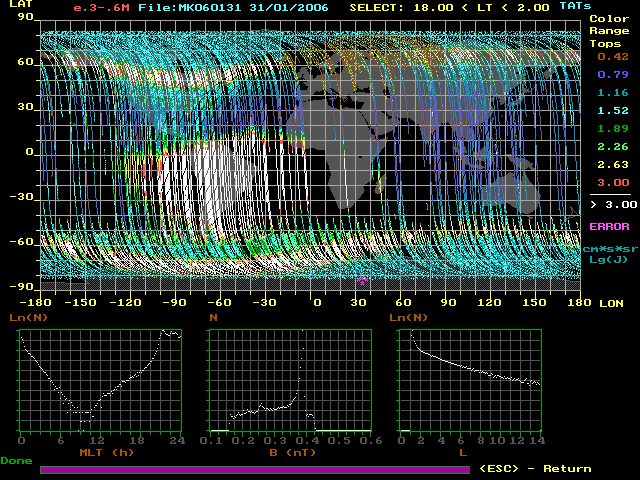
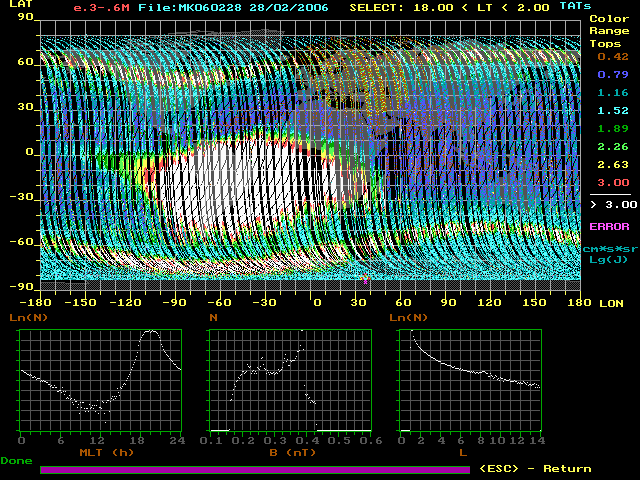
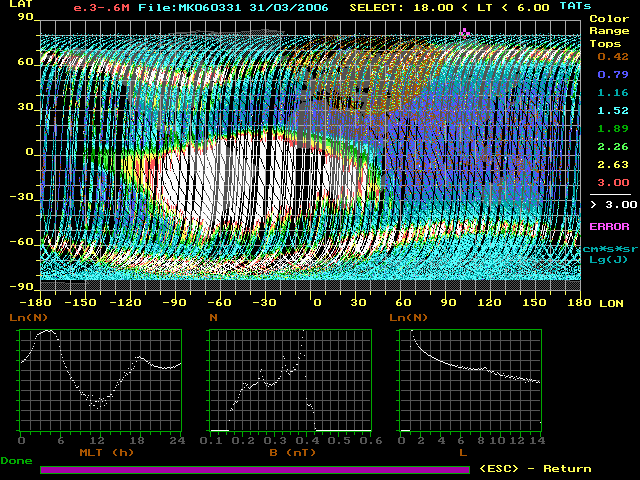
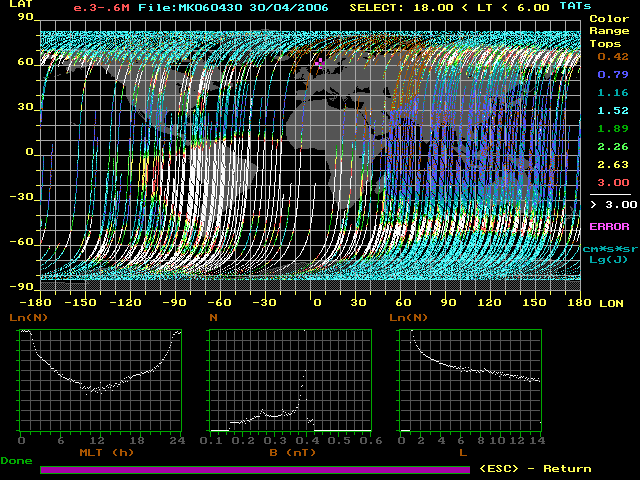
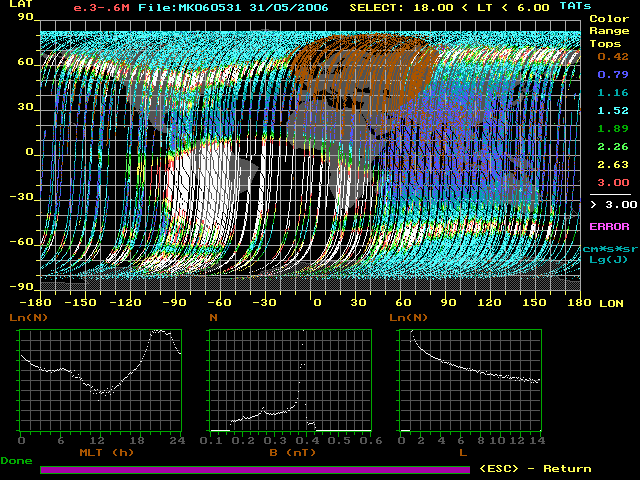
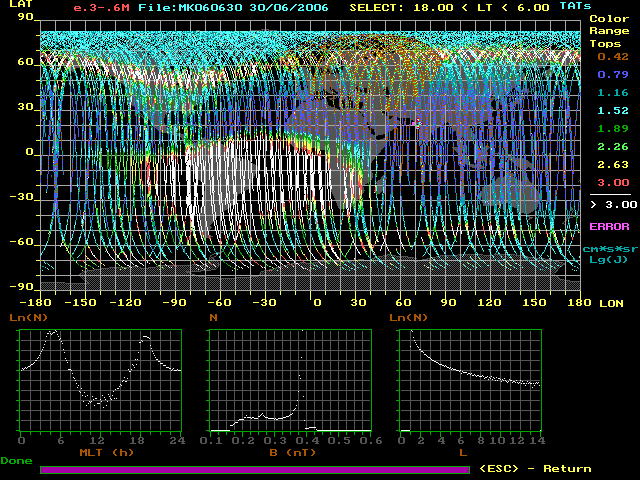
Spatial distributions (geographical map) of trapped, quasi-trapped and precipitated electrons with the energy 300-600 keV measured onboard “Universitetsky-Tatyana” satellite in evening-night MLT sectors. | 2005 | March, 1-31 | April, 1-30 | May, 1-31 | June, 1-30 | August, 1- 31 | September, 1-30 | | | 2006 | January, 1-31 | February, 1-28 | March, 1-31 | April, 1-30 | May, 1-31 | June, 1-30 | July, 1-31 |
Presented maps demonstrate the areas of trapped ( the outer ERB at high latitudes), quasitrapped ( L=2-2.5) and precipitated (L<2 ) electron flux.
2004
Coronas-F
 August |
 September |
 October |
 November |
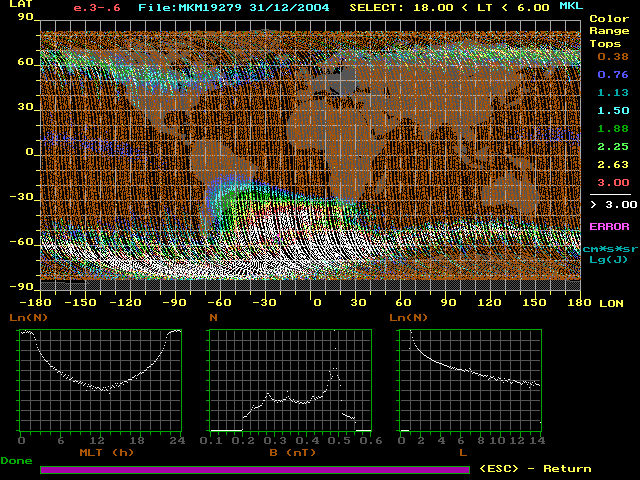 December |
2005
Coronas-F
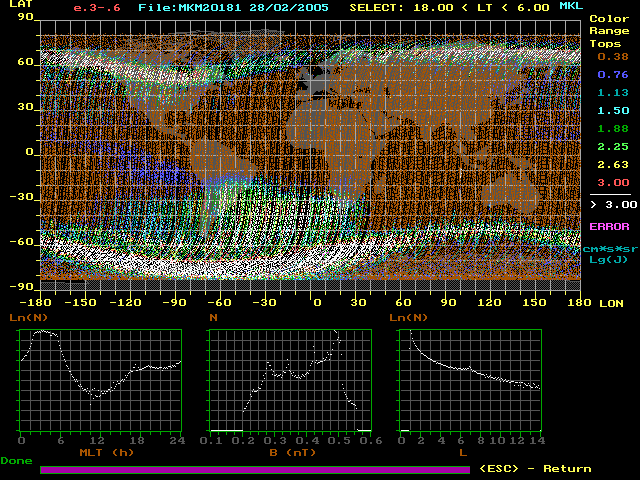 February |
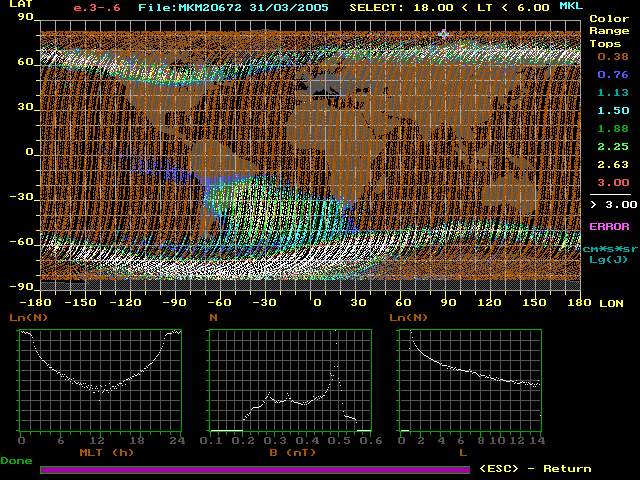 March |
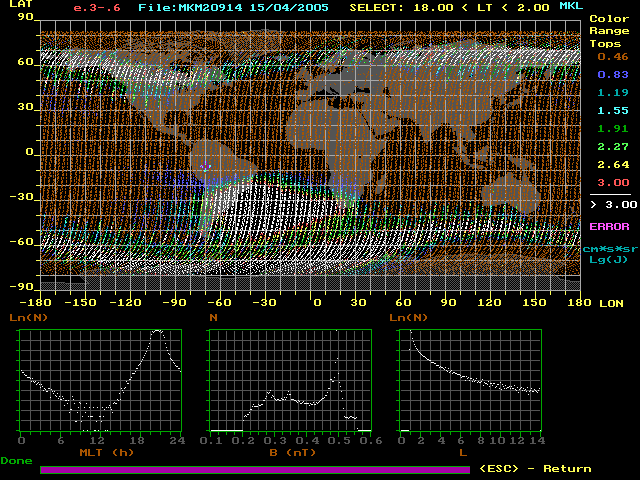 April I |
 April II |
 June |
Universitetsky-Tatyana
 March |
 April |
 May |
 June |
 July |
 August |
 September |
2006
Universitetsky-Tatyana
 January |
 February |
 March |
 April |
 May |
 June |
|
|
|
Developed in 2007. Copyright © 2007 - 2026
Skobeltsyn Institute of Nuclear Physics
Moscow State University
Feedback
|