The event selection
The SEP events were selected by GOES-8 4th channel (15-40 MeV) data (see Fig.1). By given data was determined the 24 hour time period with a maximum proton flux. The fluxes of another particles were determined in the same time period. For the particle fluence determination the 24 1-hour fluxes from Internet databases were summarized.
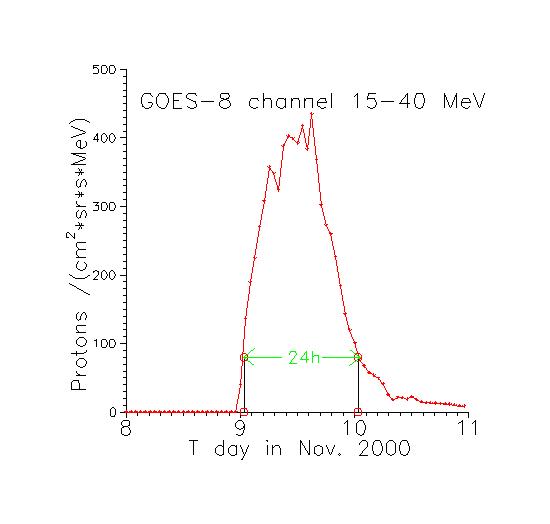
Fig. 1. The proton fluxes measured by GOES-8 instrument in energy channel 15-40 MeV from 8 to 11 Nov. 2000. The 24 hour maximum particle flux interval selected, is shown.
The energy spectra, determined from experimental data.
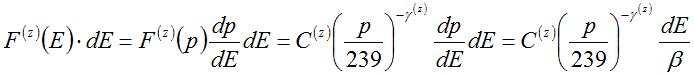
The all energy spectra are given as power function of the particle momentum (per nucleon):
where
 and
and
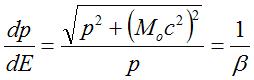
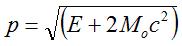
E ions kinetic energy in MeV/nucl; Moc2 =938 MeV nucleon rest energy; ß=v/c particles relative velocity. Value p=239 MeV/nucleon corresponds to the particles energy E=30 MeV/nucl and protons rigidity R=239 MV.
In case of E=30 MeV/nucleon γ(z)=γo(z) and if E < 30 MeV/nucl -
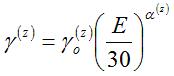
So, every spectrum is determined by 3 parameters: C(z) - spectral coefficient, γo(z) spectral index and a(z) - droop index.
On the Fig. 2 the Oxygen fluences and the corresponding energy spectra for the SEP event from 8 Nov. 2000 are demonstrated. At E=30 MeV/nucleon the spectrum is power law from particle momentum (per nucleon) with the spectral index γo(O)=8.0. At the E < 30 MeV/nucleon the spectrum droops according to the droop index α(O)=0.30 value. At the E=30 MeV/nucleon the particle fluence is F(30)=C(O)/ß, where C=28.6 and ß=0.25.
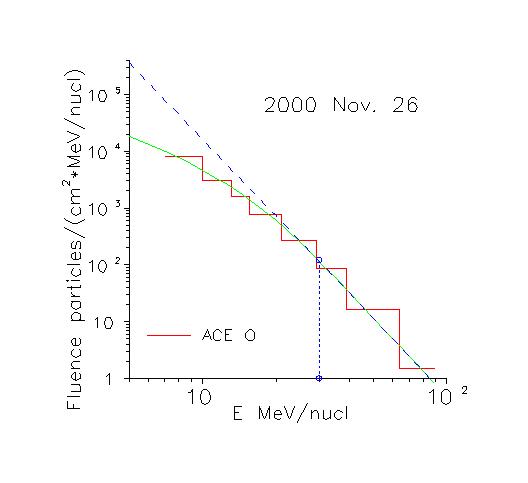
Fig.2. Measured by SIS ACE oxygen fluences for Nov. 26 2000 SEP event (the stepped line) and corresponding energy spectrum (green line). The spectrum without the droop effect (blue dashed line) is also shown.
The database content
The database contents data of 56 SEP events. The data are systematized by the 6 numbers code:
000000.
First 2 numbers are the 2 last number of the year. Examples: 00 is 2000, 06 is 2006, 99 is 1999.
Second 2 numbers are the month number, third 2 numbers are day, when the 15-40 MeV proton flux started grow from the flux background or from the flux of previous SEP event.
Each event box contents the data of 10 particle fluences (p, He, C, N, O, Ne, Mg, Si, S, Fe).
These data are distributed between 3 files.
Every file begins with the particles name first or second letters (p, H, C, N, O, Ne, M, Si, S, F) and finishes with one of three indexes a, or f, or p.
- a-file contents the measured particle fluences (energy interval and fluences are presented as stepwise data, convenient to graphic representation.
- f-file contents the differential (part/(cm2 MeV/nucl)) and the integral (part/cm2) spectra.
- p-file contents the parameters of the event particles the differential spectrum.
- number of the event
- mean square declination S the differential spectrum Ft from experimental data Fe.
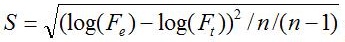 where n is the number of measurement channels.
 - Spectral coefficient C
- Spectral index γo
- Droop index α
- F(E >= 30 MeV) integral fluence of event conventional it is the event size.